E.coli-derived human Dexras1/RASD1 recombinant protein (Position: M1-S281).
Alternative Names:
RASD1, AGS1, DEXRAS1, Dexamethasone-induced Ras-related protein 1, Activator of G-protein signaling 1
Boster Bio Anti-Dexras1/RASD1 Antibody Picoband catalog A05991-1. Tested in ELISA, Flow Cytometry, WB applications. This antibody reacts with Human, Mouse, Rat. The brand Picoband indicates this is a premium antibody that guarantees superior quality, high affinity, and strong signals with minimal background in Western blot applications. Only our best-performing antibodies are designated as Picoband, ensuring unmatched performance.
Clonality:
Polyclonal
Concentration:
Adding 0.2 ml of distilled water will yield a concentration of 500 µg/ml.
Western blot, 0.25-0.5 µg/ml, Human, Mouse, Rat Flow Cytometry (Fixed), 1-3 µg/1x106 cells, Human ELISA, 0.1-0.5 µg/ml, -
Hepatic RASD1 was upregulated in patients with MASLD. ( A ) qPCR analysis showing the RASD1 mRNA expression levels in liver tissues from both groups ( n =15 each). ( B ) WB analysis of RASD1 protein levels and the corresponding quantitative analysis of liver tissues from the Normal and MASLD groups ( n =6). ( C ) Representative HE and IHC staining of liver tissues from the Normal and MASLD groups (scale bar, 50µm), on the right of which the IHC staining data is quantified and shown ( n =3). ( D ) Representative IF staining of liver tissues from the Normal and MAFLD groups (scale bar: 20µm). ** P <0.01, **** P <0.0001, comparing to those data of the Normal group. All data presented in the figure are meansSDs Index in PubMed under a CC BY license. PMID: 39731125
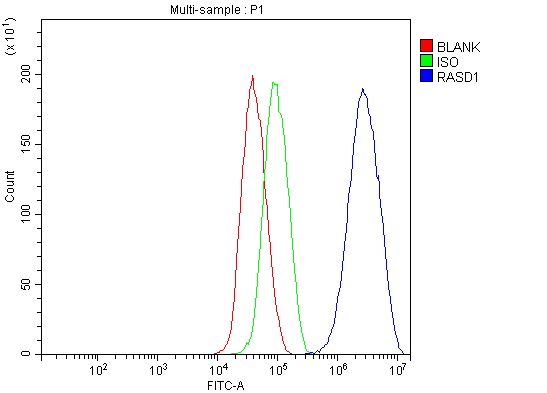
Flow Cytometry analysis of HepG2 cells using anti-Dexras1/RASD1 antibody (A05991-1). Overlay histogram showing HepG2 cells stained with A05991-1 (Blue line). To facilitate intracellular staining, cells were fixed with 4% paraformaldehyde and permeabilized with permeabilization buffer. The cells were blocked with 10% normal goat serum. And then incubated with rabbit anti-Dexras1/RASD1 Antibody (A05991-1, 1 µg/1x106 cells) for 30 min at 20C. DyLight488 conjugated goat anti-rabbit IgG (BA1127, 5-10 µg/1x106 cells) was used as secondary antibody for 30 minutes at 20C. Isotype control antibody (Green line) was rabbit IgG (1 µg/1x106) used under the same conditions. Unlabelled sample without incubation with primary antibody and secondary antibody (Red line) was used as a blank control.
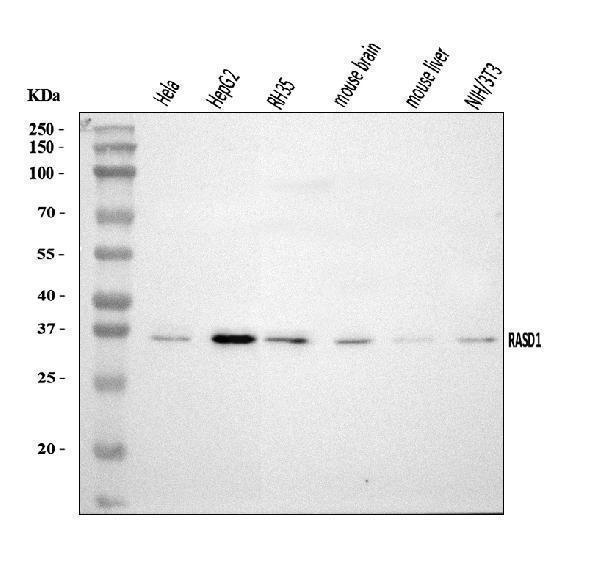
Western blot analysis of Dexras1/RASD1 using anti-Dexras1/RASD1 antibody (A05991-1). Electrophoresis was performed on a 5-20% SDS-PAGE gel at 70V (Stacking gel) / 90V (Resolving gel) for 2-3 hours. The sample well of each lane was loaded with 30 ug of sample under reducing conditions. Lane 1: human Hela whole cell lysates, Lane 2: human HepG2 whole cell lysates, Lane 3: rat RH35 whole cell lysates, Lane 4: mouse brain tissue lysates, Lane 5: mouse liver tissue lysates, Lane 6: mouse NIH/3T3 whole cell lysates. After electrophoresis, proteins were transferred to a nitrocellulose membrane at 150 mA for 50-90 minutes. Blocked the membrane with 5% non-fat milk/TBS for 1.5 hour at RT. The membrane was incubated with rabbit anti-Dexras1/RASD1 antigen affinity purified polyclonal antibody (Catalog A05991-1) at 0.5 µg/mL overnight at 4C, then washed with TBS-0.1%Tween 3 times with 5 minutes each and probed with a goat anti-rabbit IgG-HRP secondary antibody at a dilution of 1:5000 for 1.5 hour at RT. The signal is developed using an Enhanced Chemiluminescent detection (ECL) kit (Catalog EK1002) with Tanon 5200 system. A specific band was detected for Dexras1/RASD1 at approximately 32 kDa. The expected band size for Dexras1/RASD1 is at 32 kDa.
RASD1 expression was elevated in FFA-treated hepatocytes. ( A ) Representative ORO staining of hepatocytes that were treated with BSA or FFA and the corresponding quantitative analysis are presented on the right (scale bar: 50µm). ( B ) Cellular TG content of hepatocytes that were treated with BSA or FFA. ( C ) WB determination and the quantification of the RASD1 protein in hepatocytes, with or without FFA or BSA treatment. ( D ) RASD1 mRNA levels were shown by qPCR analysis results, of hepatocytes treated with BSA or FFA. (E , F) Representative IF staining images of hepatocytes treated by either BSA or FFA (the scale bar shown as 20µm). n =3 in all groups. * P <0.05, ** P <0.01, *** P <0.001, as are compared to BSA treatment. All data presented in this figure here are meansSDs Index in PubMed under a CC BY license. PMID: 39731125
Overexpression of RASD1 promoted lipid de
* VAT and and shipping costs not included. Errors and price changes excepted