
DRAM Antibody, Unconjugated, Rabbit, Polyclonal
Artikelnummer:
PRS-4033
- Bilder (6)

| Artikelname: | DRAM Antibody, Unconjugated, Rabbit, Polyclonal |
| Artikelnummer: | PRS-4033 |
| Hersteller Artikelnummer: | 4033 |
| Alternativnummer: | PRS-4033-0.02,PRS-4033-0.1 |
| Hersteller: | ProSci |
| Wirt: | Rabbit |
| Kategorie: | Antikörper |
| Applikation: | ELISA, IF, IHC-P, WB |
| Spezies Reaktivität: | Human, Mouse, Rat |
| Immunogen: | Anti-DRAM antibody (4033) was raised against a peptide corresponding to 16 amino acids near the carboxy terminus of human DRAM. The immunogen is located within amino acids 170-220 of DRAM. |
| Konjugation: | Unconjugated |
| Alternative Synonym: | DRAM Antibody: DRAM, DRAM, DNA damage-regulated autophagy modulator protein 1, Damage-regulated autophagy modulator |
| Application Verdünnung: | Optimal dilutions for each application to be determined by the researcher. |
| Anwendungsbeschreibung: | WB: 1 µg/mL, IF: 20 µg/mL, IHC: 2.5 µg/mL.Antibody validated: Western Blot in human, mouse and rat samples, Immunofluorescence and Immunohistochemistry in human samples. All other applications and species not yet tested. |
|
|
Figure 1 Western Blot Validation in Human 293 Cell LysateLoading: 15 &956,g of lysate per lane.Antibodies: DRAM 4033 (1 &956,g/mL), 1h incubation at RT in 5% NFDM/TBST.Secondary: Goat anti-rabbit IgG HRP conjugate at 1:10000 dilution. |
|
|
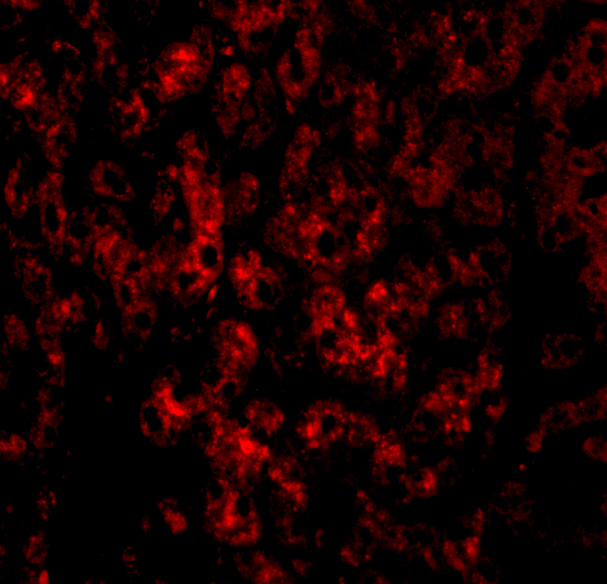
Figure 3 Immunofluorescence Validation of DRAM in Human Liver TissueImmunofluorescent analysis of 4% paraformaldehyde-fixed human liver tissue labeling DRAM with 4033 at 20 &956,g/mL, followed by goat anti-rabbit IgG secondary antibody at 1/500 dilution (red). |
|
|
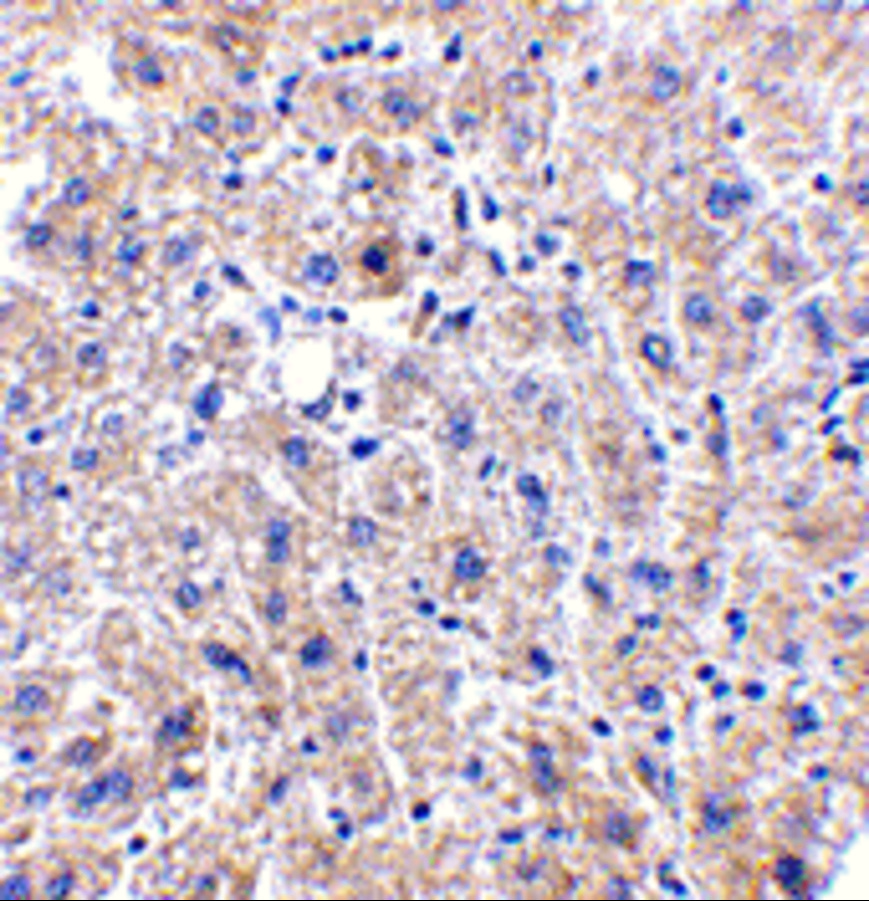
Figure 4 Immunohistochemistry Validation of DRAM in Human Liver Tissue Immunohistochemical analysis of paraffin-embedded human liver tissue using anti-DRAM antibody (4033) at 2.5 &956,g/ml. Tissue was fixed with formaldehyde and blocked with 10% serum for 1 h at RT, antigen retrieval was by heat mediation with a citrate buffer (pH6). Samples were incubated with primary antibody overnight at 4&730,C. A goat anti-rabbit IgG H&L (HRP) at 1/250 was used as secondary. Counter stained with Hematoxylin. |
|
|
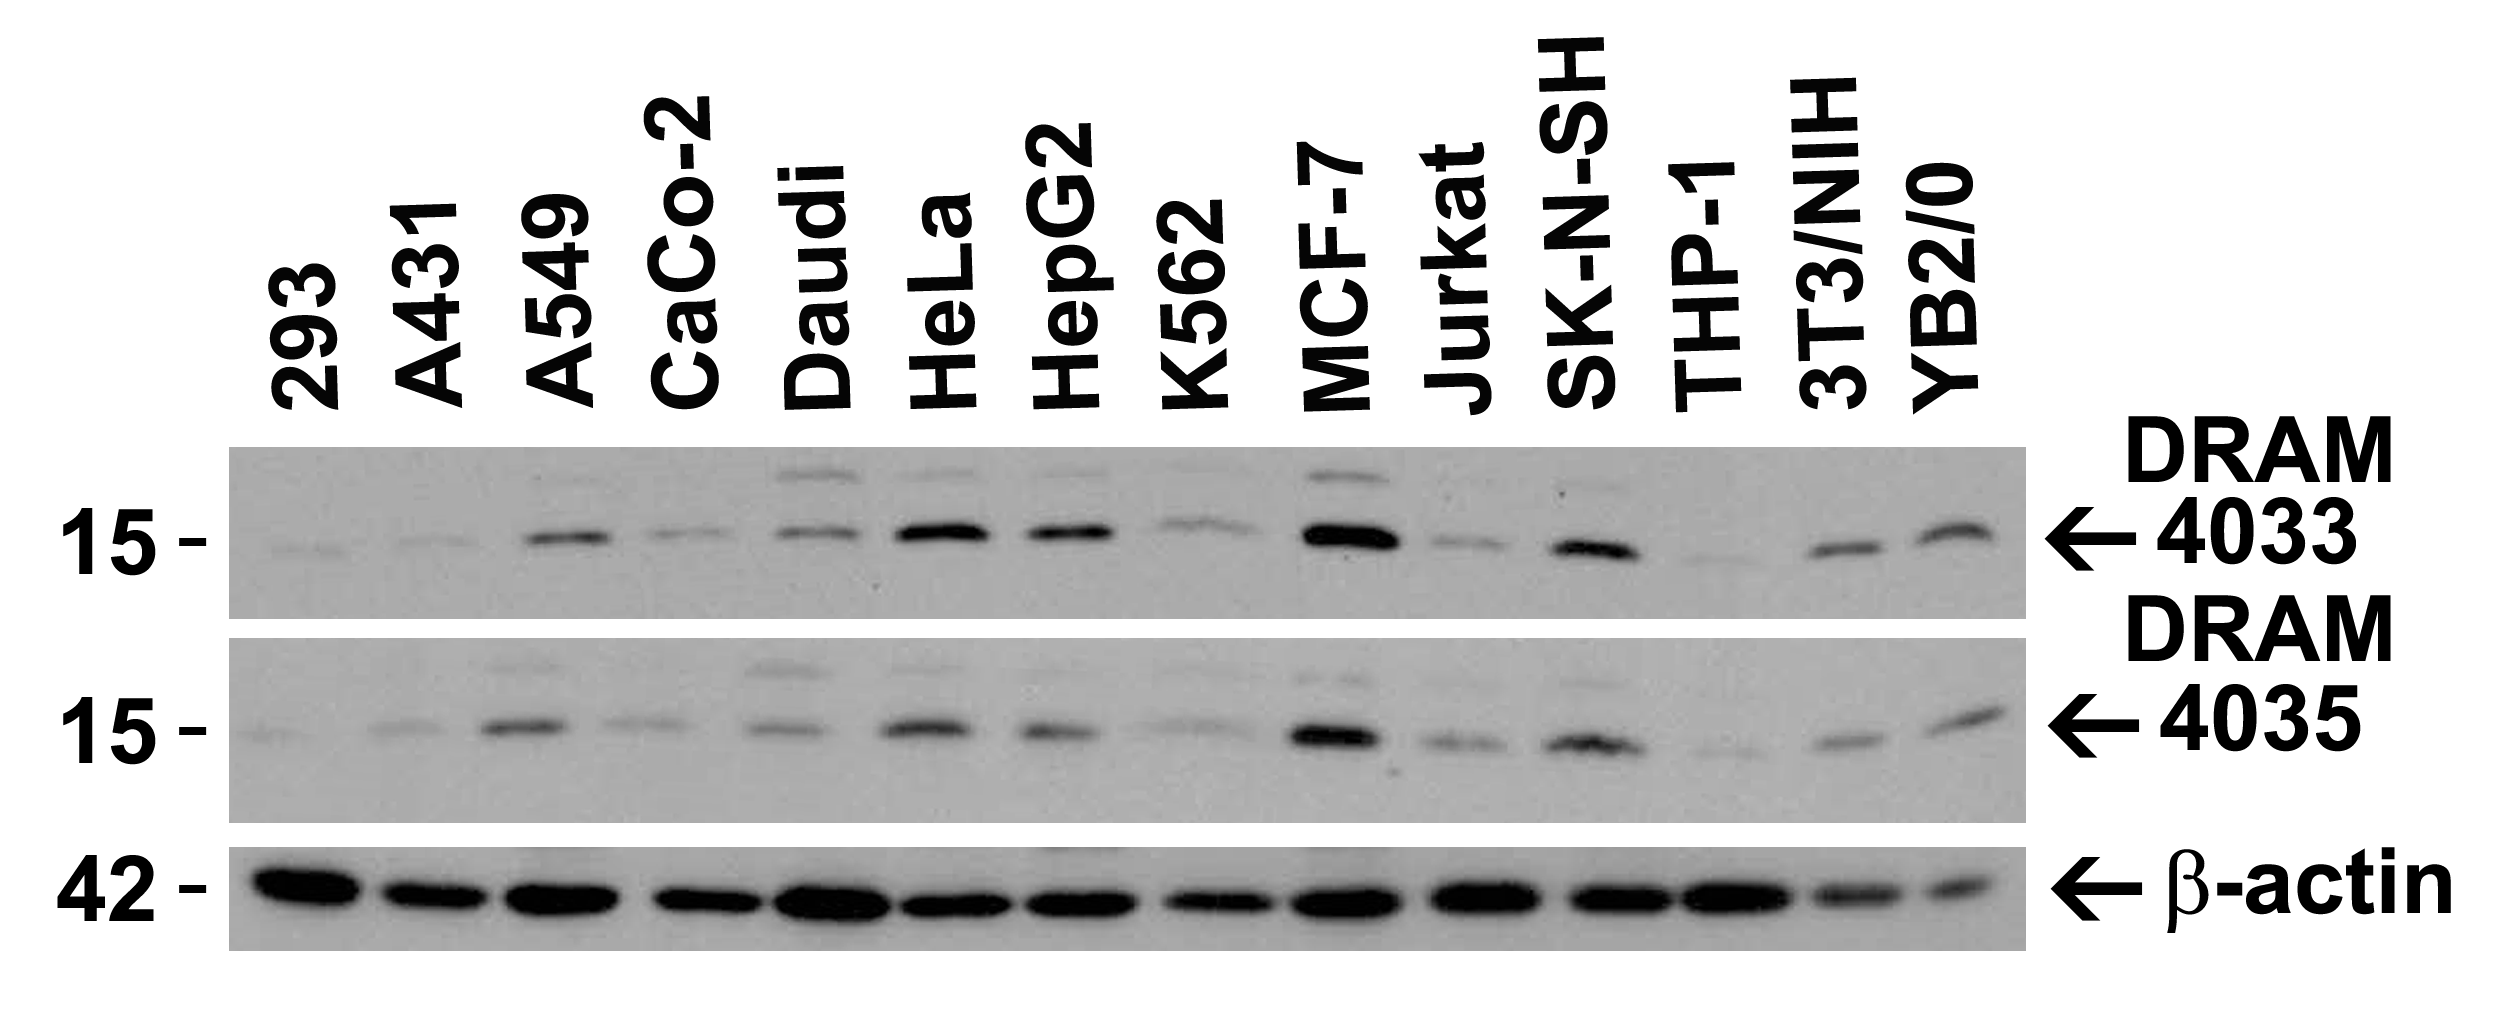
Figure 2 Independent Antibody Validation (IAV) via Protein Expression Profile in Cell LinesLoading: 15 &956,g of lysates per lane.Antibodies: DRAM 4033 (0.5 &956,g/mL), DRAM 4035 (2 &956,g/mL), beta-actin (1 &956,g/mL) and GAPDH (0.02 &956,g/mL), 1h incubation at RT in 5% NFDM/TBST.Secondary: Goat anti-rabbit IgG HRP conjugate at 1:10000 dilution. |
|
|
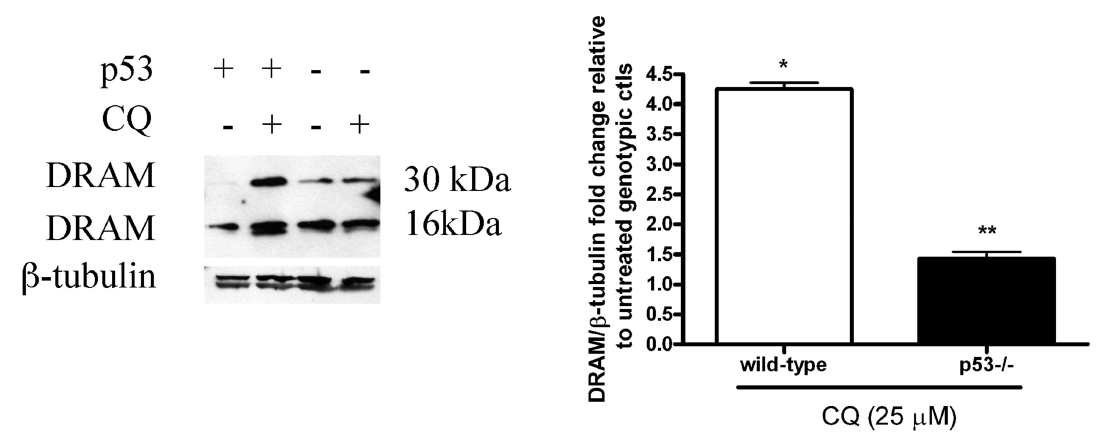
Figure 5 Induced Expression of DRAM by CQ in Mouse Neural Precursor Cells (NPCs) (Walls et al., 2010) WT and p53-deficient NPC cells were treated with or without 25&956,M CQ for 24hr. CQ treatment caused the increased expression level in both DRAM dimer (32kD) and monomer (16kD) compared to the untreated controls. WB results show DRAM induction was p53-dependent. |
|
|
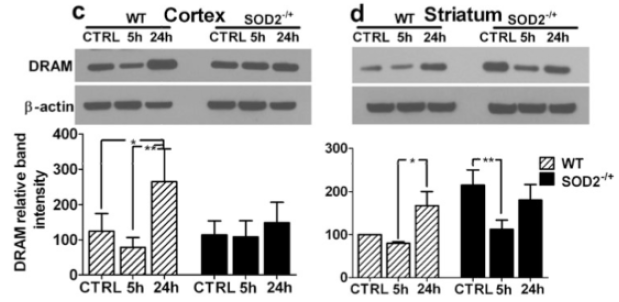
Figure 6 Regulated Expression Validation of DRAM in Heterozygous SOD2 KO Mice (Mehta et al., 2011) DRAM expression level detected by anti-DRAM antibodies (4033) decreased in striatum of SOD -/+ KO mice (fig. d) as compared to WT mice . |
Produktgarantie und fachkundiger Support
